Get into the head of the people who visit your website

At Mequoda we get about 30,000 unique visitors every month. As a niche marketing blog for publishers, that ain’t too shabby!
When visitors arrive on your website, they have a few options. If they find your content relevant, they can check out other aligned articles. If they don’t find the information to be what they seek, they can bounce off your site. If they determine your content is top-notch, they may decide to receive updates with email newsletters.
But who are those visitors? Unless they attend an event or re-tweet an article you may never know!
Thankfully Google Analytics can shed some light on those demographics and here’s how you can use that data.
[text_ad]
From your main dashboard you can see a few things:
- How many people visited your site – used to determine growth, predict revenues and measure audience development efforts
- How many of them are new visitors / returning visitors – used to determine how well you’re growing your audience vs. bringing people back
- How many pages they visit – used to determine how well you’re cross promoting other posts and white papers
- How long they stay (duration) – used to determine how much they read, or how many people bounce off
- Which language they speak / what country they come from – used to determine whether you should have a button that enables translation support
- What city they’re in – used to help local publications determine the most active regions of their area/state
- What browser and operating system they’re using – used to determine which platforms to test your site on
- Which operating system they’re using on mobile and its resolution – used to determine how responsive your site needs to be
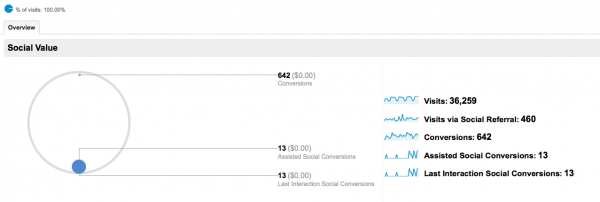
And then there’s the “social” tab in Google analytics. If set up correctly it can tell you whether your social media followers are converting into visitors and subscribers. Our conversion is the download of a white paper in this instance, so the assigned dollar value is $0.
Ideally, the commercial chain of events goes something like this…
Someone comes in from a tweet, reads your post, sees that you offer a free white paper on the same topic, joins your email list, downloads your white paper, gets an email from you about a related product later on, purchases the product…and the world continues to turn.

Below, you can also find out which social networks are driving the most traffic. In our case, we get 38% of our social media traffic from Twitter, then LinkedIn and Facebook.
The reason we care about these numbers is because social media can be such a time-suck that we want to make sure we’re choosing the right social networks.
One thing to keep in mind when looking at your social media numbers is that while social media is sometimes not a major source of traffic for some publishers, it can still be a major source of SEO power and the traffic that comes with that, so take it into account when you’re mulling numbers around in your head.
If you don’t use Google Analytics, you can use your own analytics package or get a quick snapshot through a tool like Site trail lets you spy on the website visitor statistics of your competitors too.
But is there more you can learn about your visitors other than a chart and some numbers? Sure.
Ways to find out more about your visitors:
- Include social media links on your blog posts that add your @username to the link so that you always know who and when someone tweets about your article.
- Collect email addresses with white papers and other freemiums. Try to “upsell” a white paper in every article through the use of an embedded text ad.
- Use a tool like Woopra that gives you more detail about visitor analytics and lets you assign names and profiles to IP addresses so you know when someone is a repeat visitor.
You can always bust out the spreadsheet, too. It’s not difficult to turn an IP address into a complete profile if you had some analysts looking at your visitor stats all day long.
Either way, paying attention to the number above can give you general insight into how your site should look, function and be read. Additionally, a pop-up site survey never hurt anybody.


